SigNoz is the most popular open-source log management tool, with 32,640 GitHub stars: it puts logs, metrics and traces in one OpenTelemetry-native platform. Grafana Loki is second with 29,160 stars and is the low-cost choice for teams using Prometheus and Grafana, and OpenObserve is third with 23,058 stars. To collect and ship logs, Vector, Logstash, Fluentd and Fluent Bit are the leading pipelines.
How it's ranked: GitHub stars on each project's official repository, read November 14, 2026. Stars measure developer interest, not paying customers or production use, so treat them as a guide to popularity. The list mixes full platforms (SigNoz, Loki, OpenObserve, Quickwit, Graylog, Parseable) with collectors and pipelines (Vector, Logstash, Fluentd, Fluent Bit) that send logs to a store.
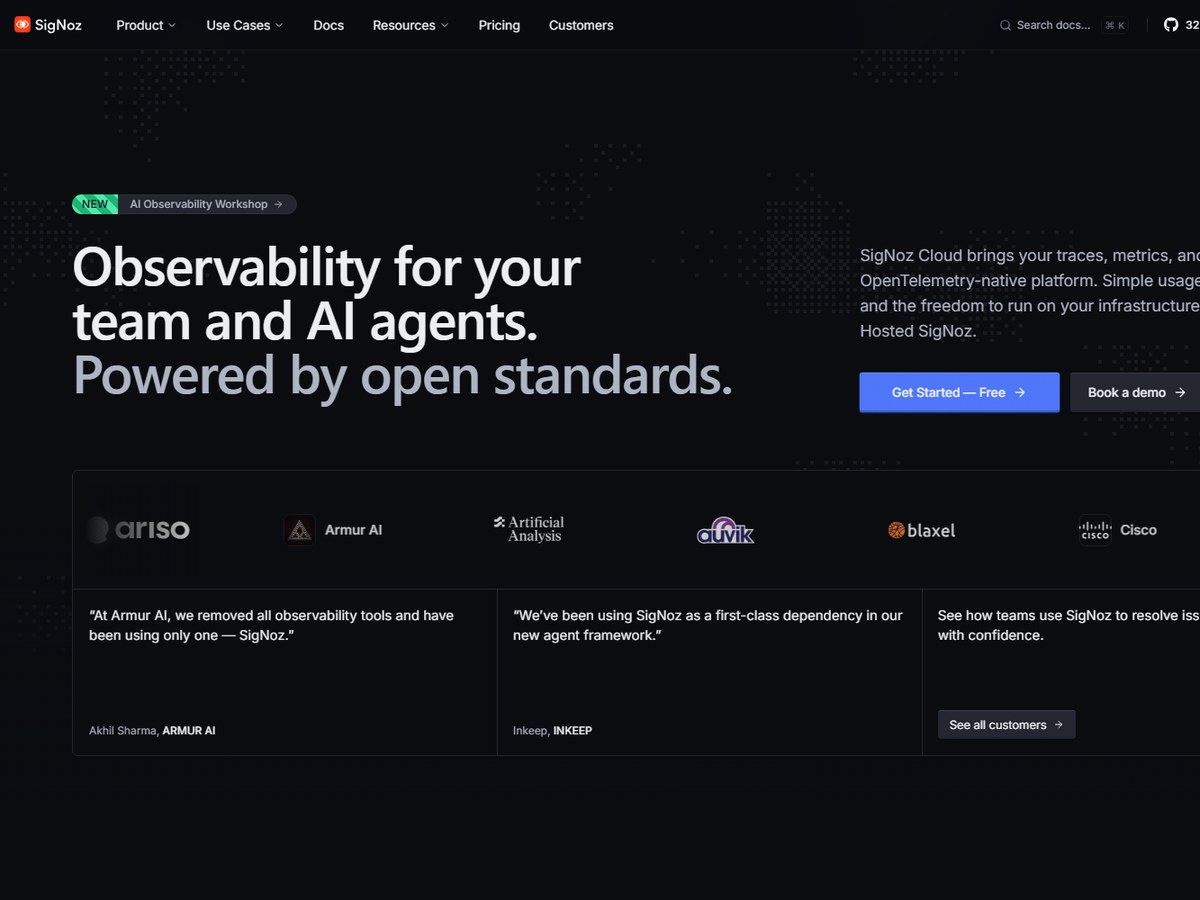
SigNoz Inc. · OpenTelemetry-native observability platform with log management
32,640 GitHub stars
The most popular all-in-one open-source pick.
SigNoz is the most-starred project on this list, with 32,640 GitHub stars. It is an open-source observability platform built on OpenTelemetry, with logs, metrics, traces, alerts and dashboards in one place. For logs, you can ingest, search, aggregate and correlate them with traces and metrics using a visual query builder. SigNoz stores data in a columnar database and says it needs 50% fewer resources than Elastic during ingestion in its own benchmark. You can run the free Community edition on your own servers with Docker, Kubernetes or Linux, or pay for SigNoz Cloud, which has a 30-day free trial with no credit card and usage-based pricing that starts at $49. It fits teams replacing a patchwork of single-purpose tools or expensive commercial platforms.
Best forTeams that want logs, metrics and traces in one open-source tool
Grafana Labs · Label-indexed log aggregation system
29,160 GitHub stars
The low-cost choice for Grafana shops.
Grafana Loki calls itself "like Prometheus, but for logs," and it has 29,160 GitHub stars. It is a horizontally scalable, highly available, multi-tenant log aggregation system built to be cheap and easy to run. The trick is that Loki does not index the full text of your logs: it stores compressed logs and only indexes a set of labels for each stream, the same labels you already use in Prometheus. That makes it an especially good fit for Kubernetes pod logs. A typical stack is Grafana Alloy to collect logs, Loki to store them and Grafana to query and display them. Loki was started at Grafana Labs in 2018 and is released under the AGPLv3 license.
Best forKubernetes teams already using Prometheus and Grafana
Skip it ifYou need fast full-text search across every word in your logs
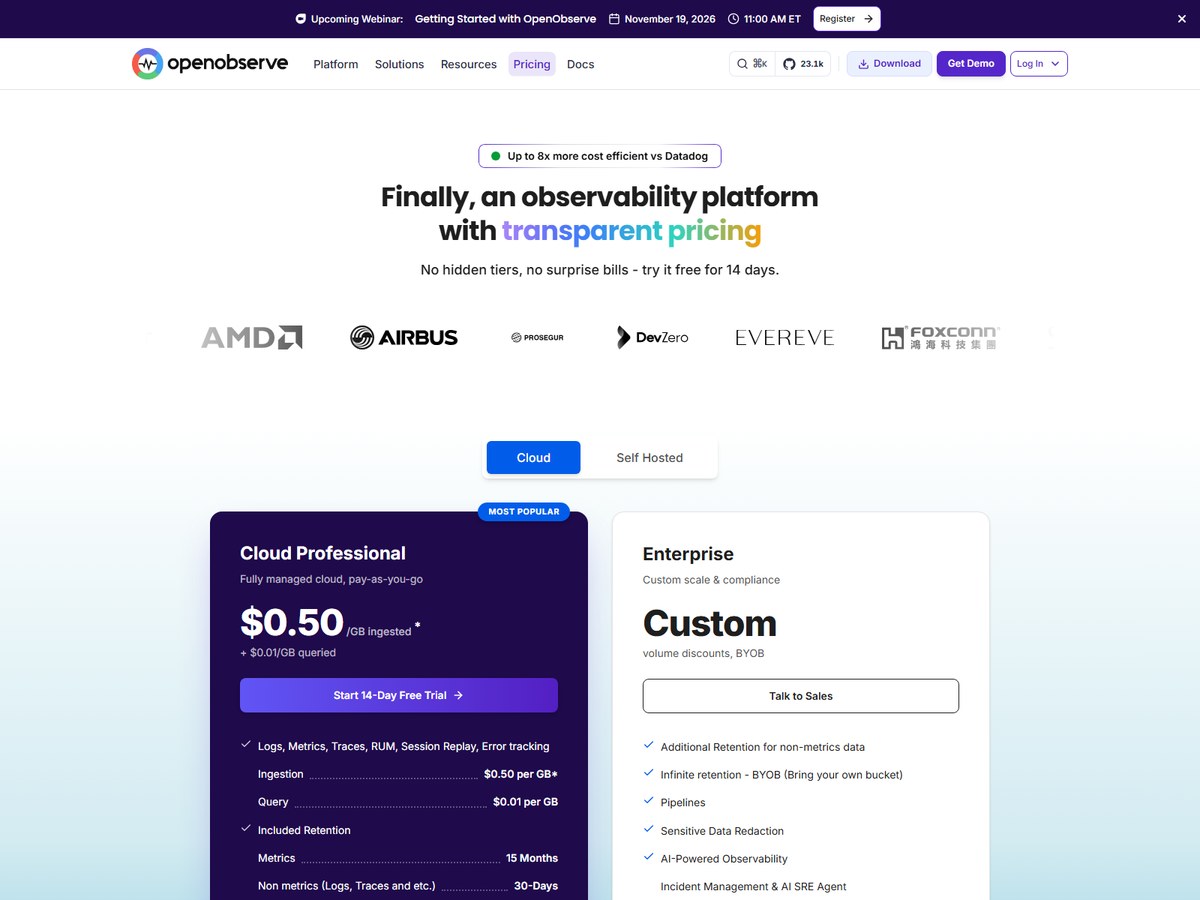
OpenObserve · Observability platform for logs, metrics, traces and RUM
23,058 GitHub stars
Big storage savings in a single binary.
OpenObserve (O2) has 23,058 GitHub stars and pitches itself as a cost-effective alternative to Datadog, Splunk and Elasticsearch. It is a cloud-native platform for logs, metrics, traces, analytics, Real User Monitoring and AI/LLM observability. Its storage uses the Parquet columnar format and an S3-native design that OpenObserve says cuts storage costs by up to 140x compared with Elasticsearch. It runs as a single binary written in Rust, and the project says you can be up and running in under 2 minutes. You query logs with SQL and metrics with SQL or PromQL, with no proprietary query language. The open source edition is AGPL-3.0 and runs in production across thousands of deployments, according to the project; an Enterprise edition adds extra features under a commercial license.
Best forTeams looking for a cheaper alternative to Elasticsearch, Splunk or Datadog
Skip it ifYou want a tool with a long track record
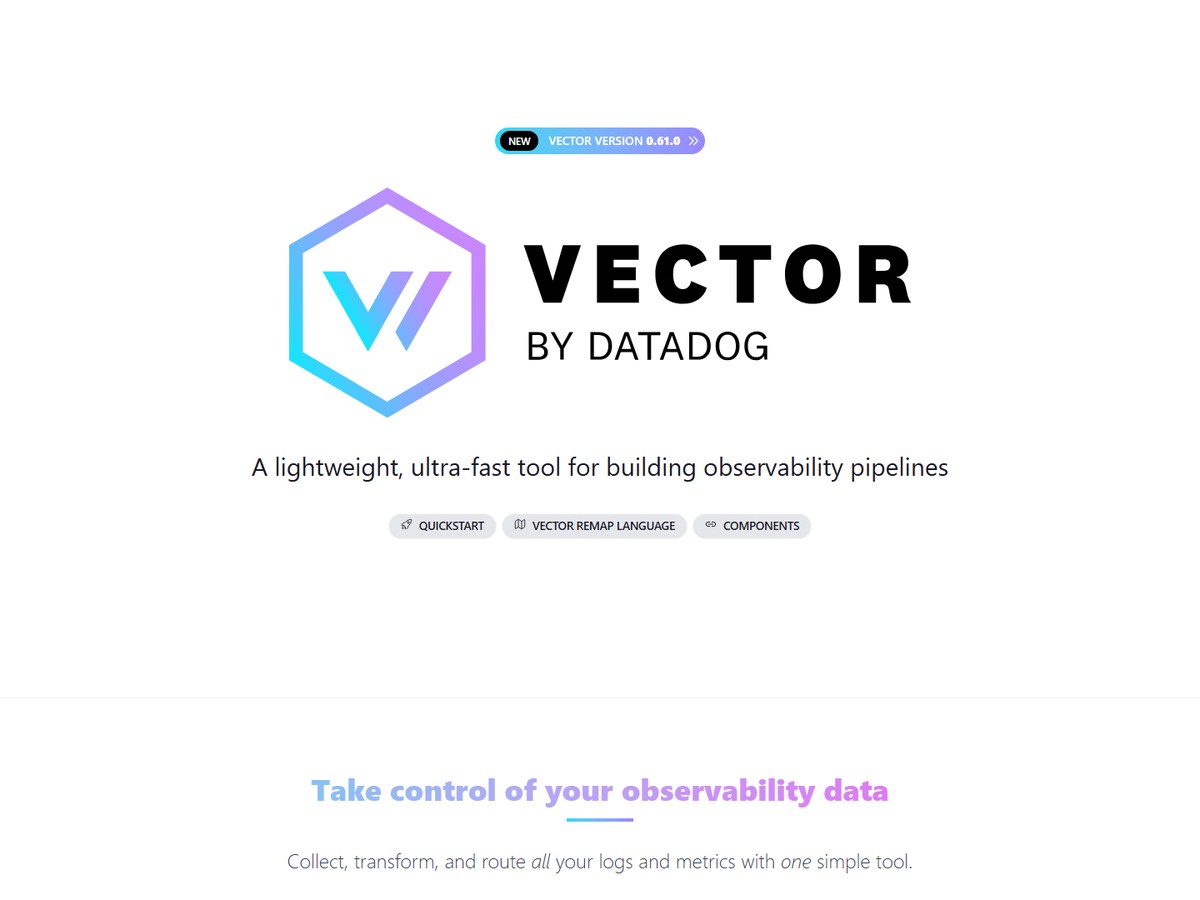
Datadog · Observability data pipeline (agent and aggregator)
22,871 GitHub stars
The fast, vendor-neutral log pipeline.
Vector is a high-performance observability data pipeline with 22,871 GitHub stars. It is not a place to store logs: it collects, transforms and routes your logs and metrics to whatever vendors you choose, today or tomorrow. It deploys either as an agent on each machine or as an aggregator, and it is built in Rust with reliability as its main design goal. Its stated use cases include cutting observability costs, switching vendors without disrupting workflows and consolidating agents. Vector says it powers pipelines at Atlassian, Riot Games, Comcast, FanDuel, OpenAI and Anthropic, among others. It is 100% open source under the MPL-2.0 license and is maintained by Datadog's Community Open Source Engineering team.
Best forTeams that want to collect and route logs to any backend
Skip it ifYou need somewhere to store and search logs
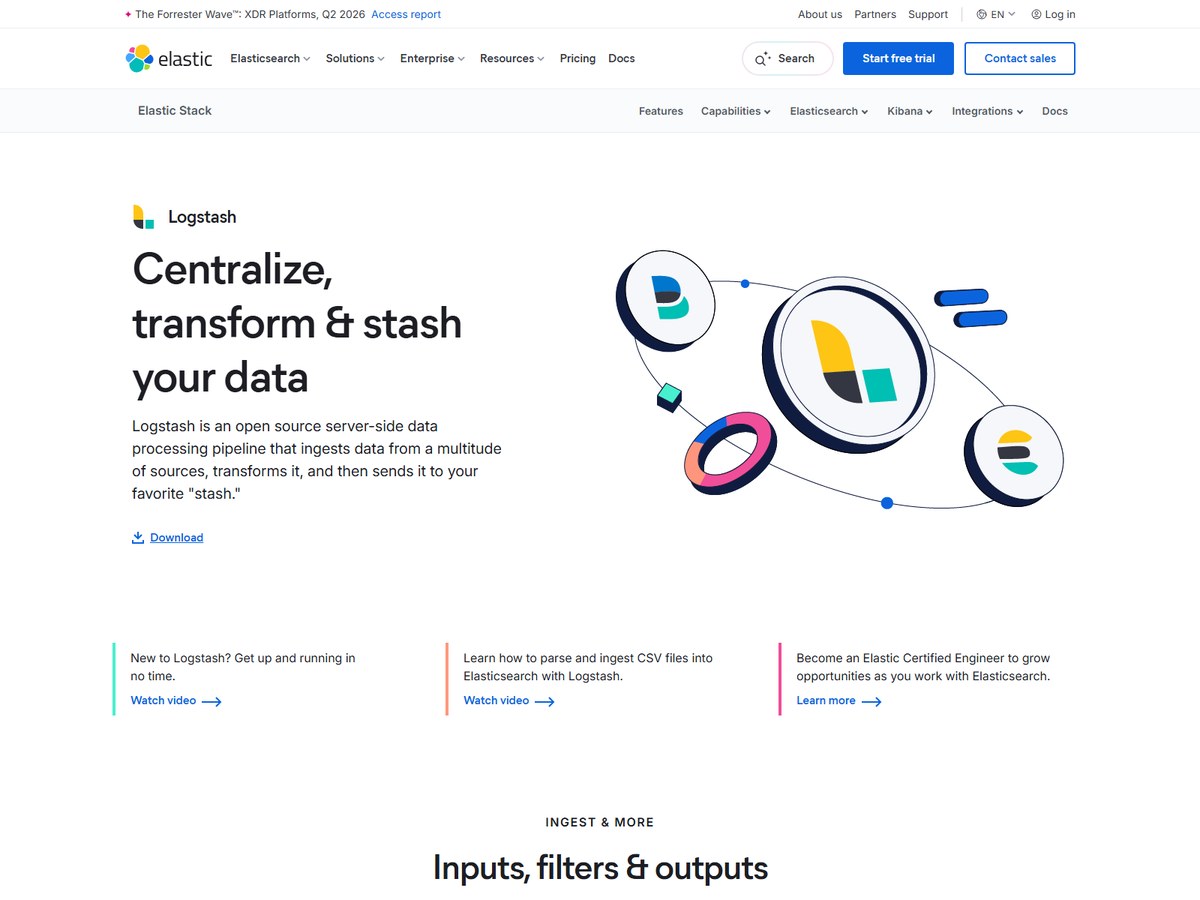
Logstash has 14,980 GitHub stars and is part of the Elastic Stack along with Beats, Elasticsearch and Kibana. Logstash is a server-side data processing pipeline that ingests data from many sources at the same time, transforms it and sends it to your favorite "stash," which for Elastic is naturally Elasticsearch. Its strength is reach: Logstash has over 200 plugins, each one a self-contained Ruby gem, and you can write your own. The repository includes both open-source code and Elastic-licensed X-Pack features. Building Logstash from source needs JDK 21, and you can run only the OSS-licensed code by setting an OSS flag. It suits teams that already search their logs in Elasticsearch and Kibana and need flexible parsing of messy, mixed-format logs before they are indexed.
Best forTeams running Elasticsearch and Kibana
Skip it ifYou want a lightweight agent on every server
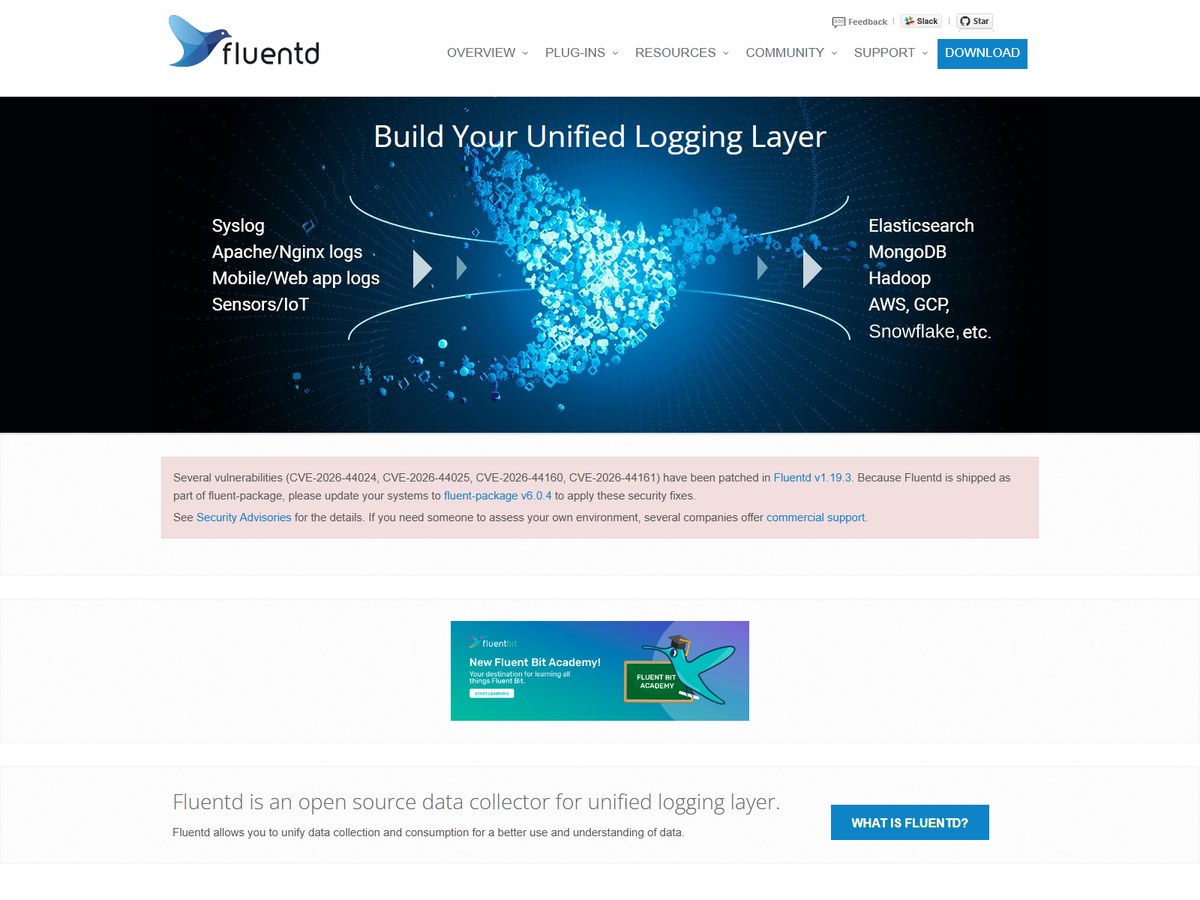
Fluentd is an open-source log collector with 13,614 GitHub stars, and it is a graduated project of the Cloud Native Computing Foundation. Its aim is a "unified logging layer": Fluentd collects events from many data sources and writes them to files, relational and NoSQL databases, cloud services, Hadoop and more. Its site says it has 500+ plugins and that 5,000+ data-driven companies rely on it, with its largest user collecting logs from 50,000+ servers. Fluentd was written by Sadayuki Furuhashi, runs on Ruby, and is licensed under Apache 2.0. A third-party security audit was done by Cure53. It fits teams that want one flexible collector in front of every logging backend; for a lighter agent, its sister project Fluent Bit is also on this list.
Best forTeams that need to collect logs from many sources into many destinations
Skip it ifYou need a very light agent on small devices
Quickwit (now part of Datadog) · Search engine for logs and traces on cloud storage
11,794 GitHub stars
Fast log search straight on object storage.
Quickwit is an open-source search engine for observability, with 11,794 GitHub stars. It calls itself the fastest search engine on cloud storage, with sub-second search directly on Amazon S3, Azure Blob Storage and Google Cloud Storage. Compute and storage are separate, with stateless indexers and searchers. It offers full-text search and aggregations, schemaless or strict schema indexing, native OpenTelemetry support for logs and traces, and an Elasticsearch-compatible API so existing Elasticsearch or OpenSearch clients can use it. It can read data from Kafka, Kinesis and Pulsar, supports retention policies and delete tasks for GDPR use cases, and works as a Grafana data source. Quickwit is licensed under Apache 2.0, and its website announces that Quickwit has joined Datadog.
Best forTeams with huge log volumes stored in S3, Azure or Google Cloud
Skip it ifYou want a complete platform with dashboards built in
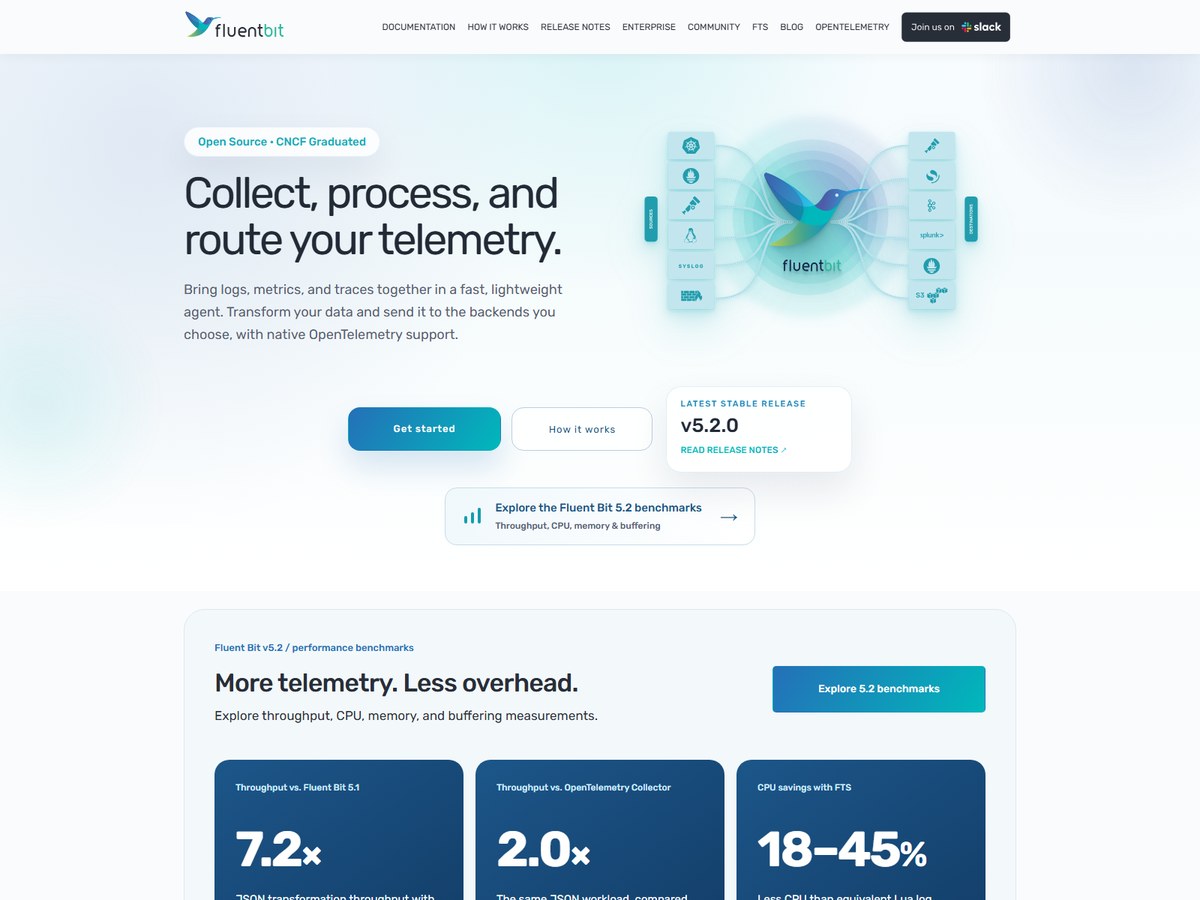
Fluent project (CNCF) · Lightweight telemetry agent for logs, metrics and traces
8,189 GitHub stars
The lightest log shipper here.
Fluent Bit is a lightweight, high-performance telemetry agent with 8,189 GitHub stars. It collects, processes and forwards logs, metrics and traces from any source to any destination, and it is part of the graduated Fluentd ecosystem under the Cloud Native Computing Foundation. Fluent Bit is built for maximum efficiency with a minimal CPU and memory footprint, and it runs on Linux, Windows, macOS, BSD and embedded systems. It has 70+ built-in plugins for inputs, filters and outputs, SQL stream processing, built-in TLS, and Prometheus-style internal metrics. You can write plugins in C, filters in Lua and outputs in Go. The project ships major releases every 3 to 4 months and is open source under Apache 2.0.
Best forKubernetes, edge and embedded setups where CPU and memory are tight
Skip it ifYou need a log store or search interface
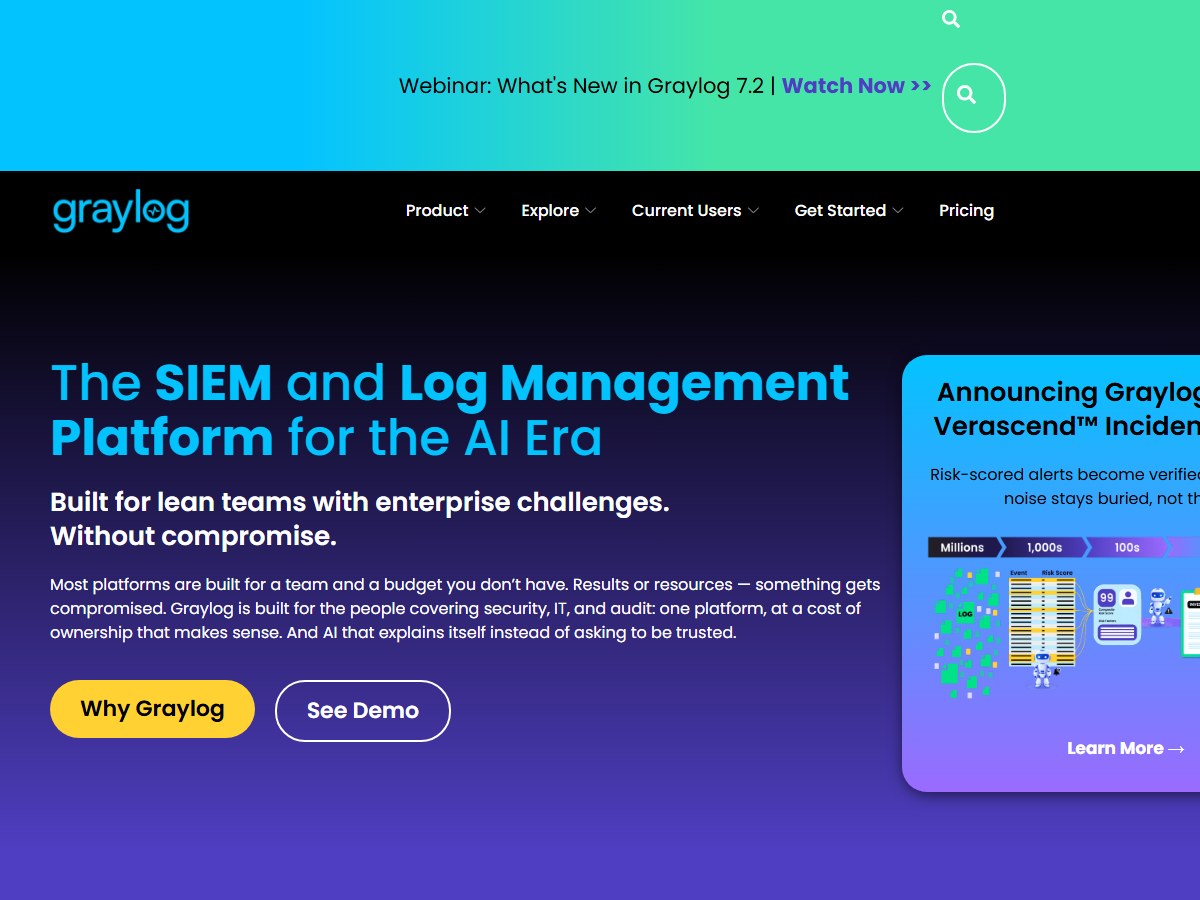
Graylog is a log management platform with 8,178 GitHub stars, and it has grown into a SIEM as well. Graylog says it started in 2009 as an open source log management project, and its site cites 60,000+ installations and 250,000+ users, with capacity figures of 1,000,000 messages per second and 100 TB per day. It comes in three editions: Graylog Open, which is free, self-managed and source-available; Graylog Enterprise for centralized log management; and Graylog Security, its SIEM. Graylog says it was recognized in the 2025 Gartner Magic Quadrant for SIEM. Note the license: the open server is released under the Server Side Public License (SSPL), which is source-available rather than OSI open source.
Best forIT and security teams that want log management and a SIEM together
Skip it ifYou need an OSI-approved open-source license
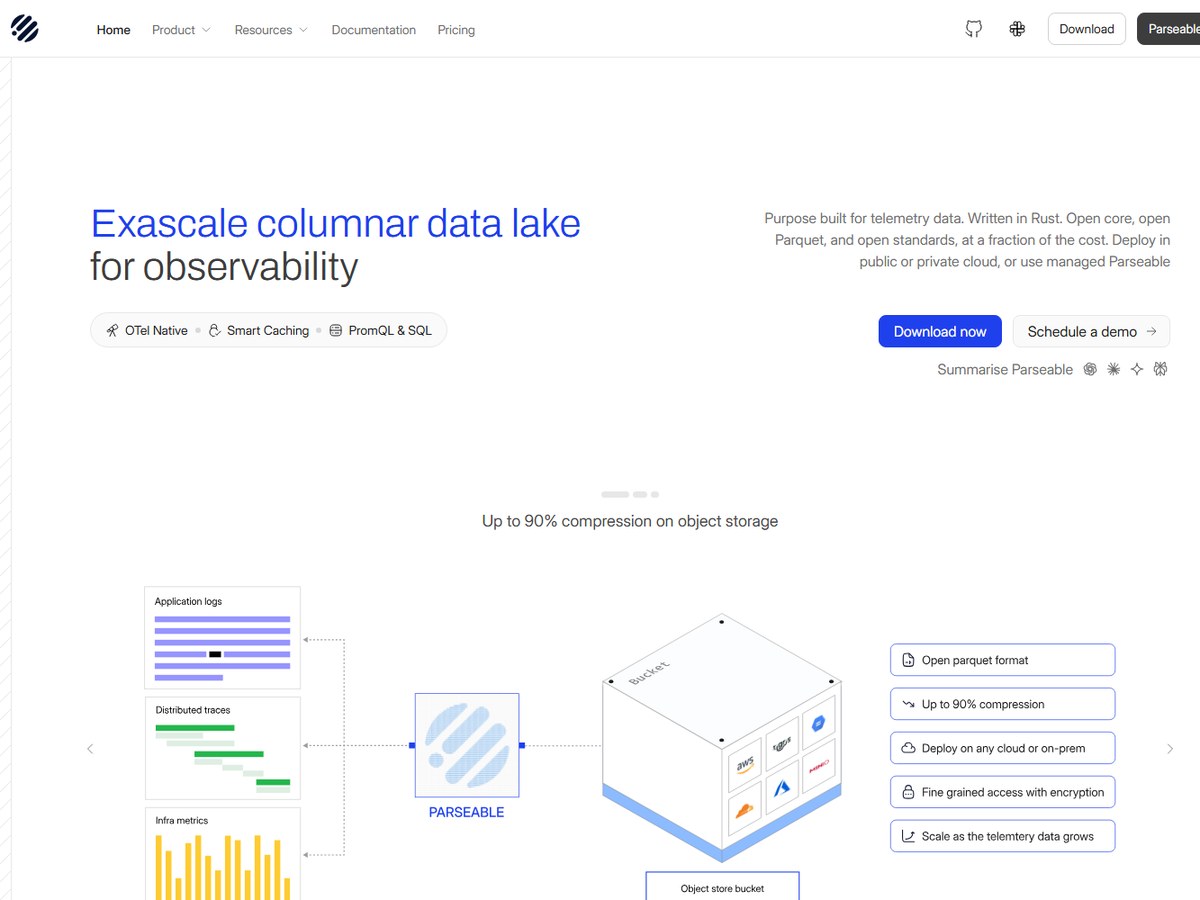
Parseable · Columnar data lake for logs, metrics and traces
2,577 GitHub stars
A lean, Rust-built log lake.
Parseable is the newest and smallest project here, with 2,577 GitHub stars. It is an open source, columnar data lake platform built for observability: you send logs, metrics and traces through common logging agents, OpenTelemetry, Kafka or eBPF, and it stores them on object storage. Compute is stateless, so storage and compute scale separately. Parseable says its columnar compression cuts storage costs by up to 90%. Alerting, dashboards, anomaly detection, APM, PromQL and SQL all come in a single binary written in Rust, and it can act as a drop-in replacement for an OpenTelemetry Collector setup. It is licensed under AGPL-3.0, and you can self-host it or use managed Parseable.
Best forTeams that want cheap log storage on object storage in one binary
Skip it ifYou want the largest community and ecosystem
SigNoz is the most-starred open-source option, with 32,640 GitHub stars, and handles logs, metrics and traces in one place. Grafana Loki, with 29,160 stars, is the cheapest to run if you already use Grafana and Prometheus.
What is the difference between a log collector and a log management platform?
A collector such as Fluent Bit, Fluentd, Vector or Logstash gathers, transforms and ships logs. A platform such as SigNoz, Loki, OpenObserve, Graylog or Parseable stores them and lets you search, chart and alert on them. Most teams use one of each.
Is Grafana Loki better than Elasticsearch for logs?
Loki only indexes labels, not the full text of logs, so it is simpler and cheaper to run but slower for free-text searches. It is an especially good fit for Kubernetes pod logs.
Which log management tools are fully open source?
Fluentd, Fluent Bit and Quickwit are Apache 2.0, Vector is MPL-2.0, and Loki, OpenObserve and Parseable are AGPL-3.0. SigNoz is MIT outside its enterprise folders. Graylog uses the source-available SSPL, and Logstash ships with some Elastic-licensed features.
How were these tools ranked?
By GitHub stars on each project's official repository, read November 14, 2026.
How we ranked
GitHub stars on each project's official repository, read November 14, 2026. Stars measure developer interest, not paying customers or production use, so treat them as a guide to popularity. The list mixes full platforms (SigNoz, Loki, OpenObserve, Quickwit, Graylog, Parseable) with collectors and pipelines (Vector, Logstash, Fluentd, Fluent Bit) that send logs to a store. Every number on this page comes from the source linked under each pick, and every photo shows the actual product. Brands can't pay to be on this list.

 Grafana Loki29,160 GitHub stars
 OpenObserve23,058 GitHub stars